
neuromore Studio
Getting Started
In this tutorial you build your first neurofeedback application in neuromore Studio from scratch: a video whose brightness follows a biosignal. You don’t need a biosensor to follow along. You learn how to build a signal processing pipeline, define application logic and work with the layout.
What will we build?
Section titled “What will we build?”The application first asks the user how long the session should run. It then plays a video whose brightness follows the average Alpha band amplitude of one EEG channel.
This is a demo of the workflow, not a validated method. We use the Alpha amplitude because it is a simple signal to work with. A real application would at least measure a personal baseline first.
The finished classifier looks like this:
Test System (Pz)└─> FFT    ├─> View    └─> Frequency Band (Alpha)        └─> Remap (0-30 to 0-1)            └─> Statistics (mean, 3 s)                └─> Brightness Control
Session Info (Elapsed Time)└─> Compare, input x
Parameter "Duration"└─> Compare, input y
Compare (x > y)└─> Custom Feedback "TimerEnded"
The finished state machine looks like this:
Start└─> Select Duration, one of:    ├─> button "1 minute"  ─> 1 min    ├─> button "3 minutes" ─> 3 mins    └─> button "5 minutes" ─> 5 mins
1 min, 3 mins or 5 mins└─> Play Video & Audio    └─> End
Before you start
Section titled “Before you start”neuromore Studio requires a neuromore account. You sign in when Studio starts, and there is no offline mode. You can create a free community account. Studio sends session details to the neuromore cloud when a session ends. Whether physiological data is uploaded depends on your account. See the Privacy Policy.
Commercial clients can have their own instance of the neuromore cloud, deployed in their own cloud account, and their own neuromore account. Contact neuromore or see the Platform page.
To install Studio, see Installation.
The windows, layouts, nodes and devices you see depend on your account, so yours may differ from this page.
Some screenshots come from an earlier Studio version. They show your personal folder under a long ID instead of “My files”, and their Feedback window shows other value names. Where a screenshot and the text differ, follow the text. File names in the screenshots are only examples.
A neuromore application in a nutshell
Section titled “A neuromore application in a nutshell”A neurofeedback or biofeedback application created in neuromore Studio has 3 parts:
- A classifier holds the signal processing pipeline. It applies operations like FFTs or filters to the biosensor data, then passes the results to feedback values, views or log files. In our example it calculates the Alpha amplitude.
- A state machine holds the application logic. In our example it handles the flow from starting the session, through selecting the duration, to playing the video. A session can also run with a classifier alone.
- The experience is what your users interact with. This can be Studio’s Experience window, as in this example, or a game or other application that receives feedback values over OSC.
Creating a blank project
Section titled “Creating a blank project”Classifiers and state machines are stored in the neuromore cloud. You manage them in the Back-End File System window.
The buttons for creating files and folders stay disabled until you select a folder you are allowed to create files in, so select your personal folder first.
- In the Back-End File System window, select My files, your personal folder.
- Click the Create new folder icon, or right-click the folder and choose Create Folder.
- Enter a name, for example
MyFirstApp, and click Ok.
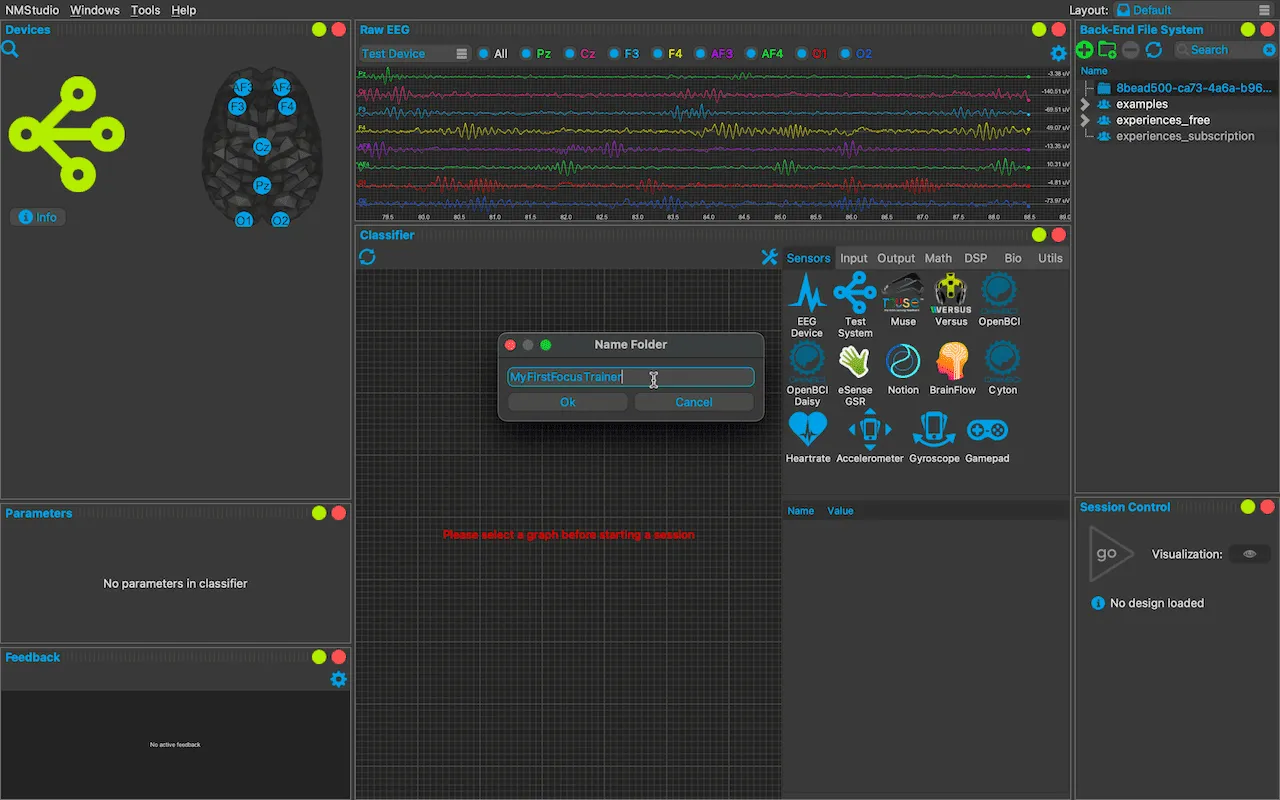
Creating a new classifier
Section titled “Creating a new classifier”Classifiers and state machines are stored in separate files.
- Select your new folder.
- Click the Create new file icon, or right-click the folder and choose Create File.
- Enter a name, leave the type on Classifier, and click Ok.
- Double-click the new file to open it. Creating a file does not open it.
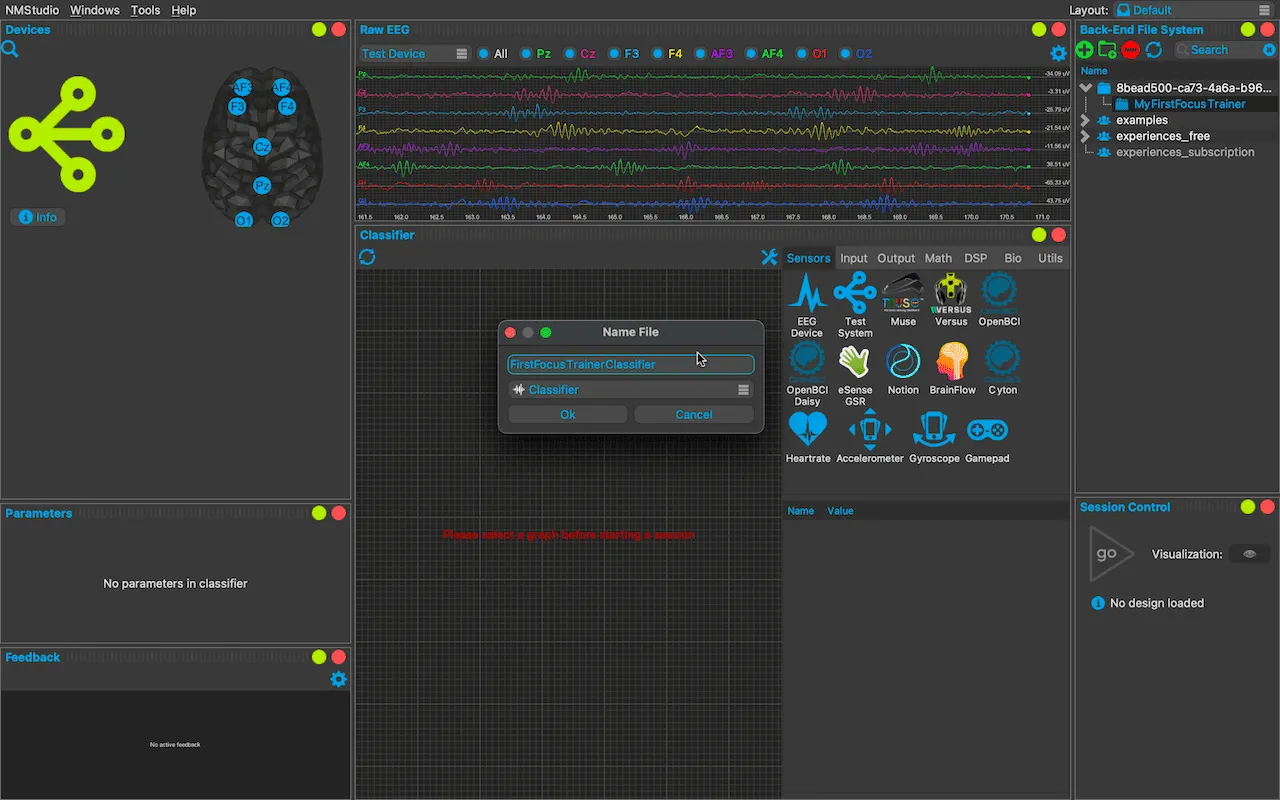
The Classifier window now shows your empty graph, with the node palette and the attributes of the selected item at its side. If the palette is hidden, click the wrench icon on the window’s toolbar.
Adding a biosensor
Section titled “Adding a biosensor”The Sensors category of the palette lists the available devices. Use one of the sources below. Drag its node into the graph.
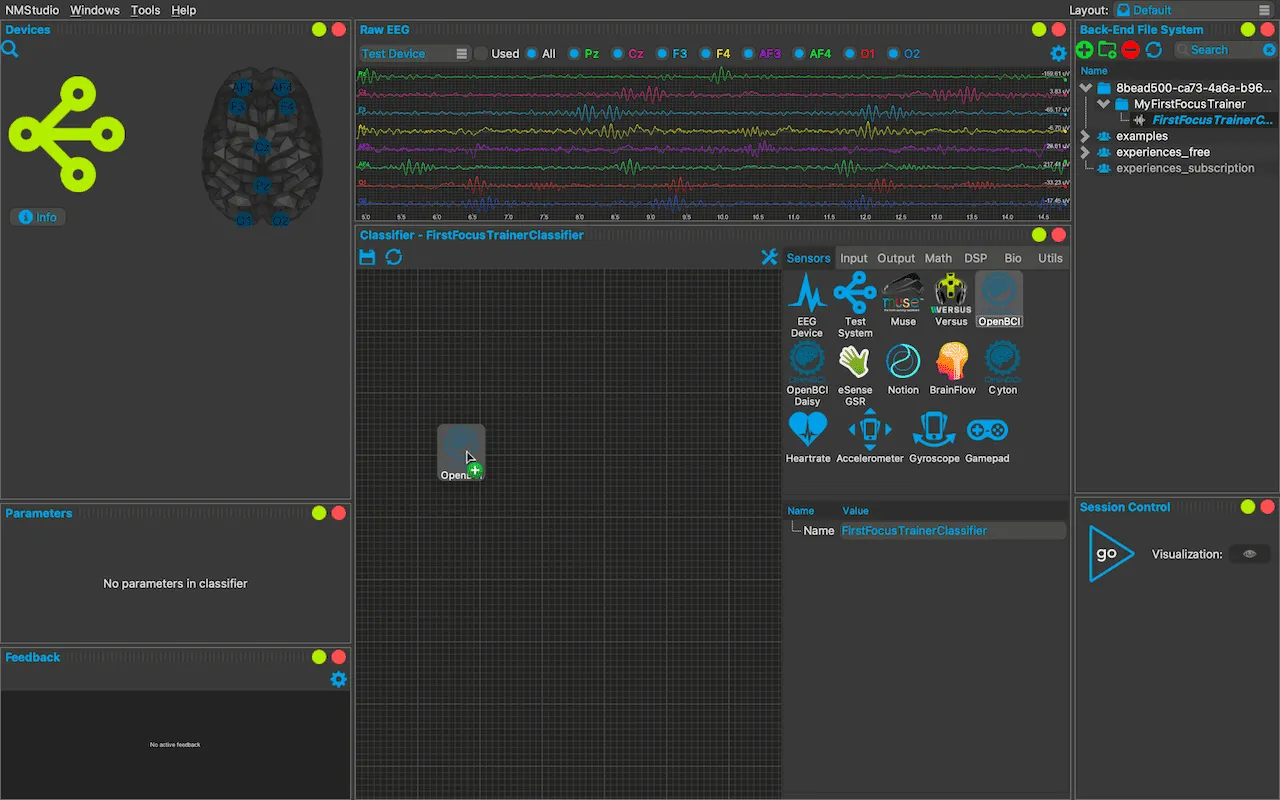
A device node has an EEG output with all channels, plus one output per channel. Use a single channel output for this tutorial. A Brightness Control node reads only the first channel it receives, so a multi-channel signal would still drive the feedback from one electrode. In addition, Frequency Band averages across the frequency bins of the band, not across channels.
Without hardware: Test System
Section titled “Without hardware: Test System”Drag in the Test System node. Its signal comes from Studio’s test device, which generates sine waves in the Delta, Theta, Alpha and SMR ranges plus noise, at 128 Hz on 8 channels. The test device is on by default (NMStudio > Settings > Devices > Drivers > Enable Test Devices). Studio adds it when no other device is connected and removes it when a real device connects.
Use the Pz output.
Without hardware: BrainFlow Synthetic
Section titled “Without hardware: BrainFlow Synthetic”Use this if Test System is not in your palette. Drag in the BrainFlow node, leave Board ID on Synthetic, and press Apply. The node gets one output per channel, and the board generates its signal at 250 Hz. Use the first channel output, Fz.
When you open a saved classifier again, press Apply again. Nothing connects until you do. See BrainFlow.
With an OpenBCI board
Section titled “With an OpenBCI board”- For a Cyton, use the OpenBCI node.
- For a Cyton with a Daisy, use the OpenBCI Daisy node.
- The node named Cyton is a separate route that goes through BrainFlow. It is not controlled by the setting below. If you use it, see BrainFlow.
- A Ganglion has no native node and is only reachable through BrainFlow.
Before you connect the board, check that NMStudio > Settings > Devices > Drivers > Enable OpenBCI Devices is on. It is on by default. This path is the same on Windows, macOS and Linux.
Then connect the board to your computer. The following advice comes from the operating system and the vendor. Studio does not set it for you.
Windows: Make sure your board is recognized as a COM port and that its latency is set to 1 ms. To troubleshoot, read the OpenBCI on Windows tutorial on their official site.
macOS: Make sure your board is connected and visible as a device. To check, type ls /dev/tty.* in your terminal. A connected board looks like this:
neuromore-MacBook:~ neuromore$ ls /dev/tty.*/dev/tty.OpenBCI-DN00959RTo troubleshoot, visit OpenBCI’s FTDI buffer fix for macOS site.
The packaged macOS app runs in a sandbox, and its permissions cover USB and Bluetooth but do not list serial ports. It may be unable to open a serial port even if this check succeeds.
Connect an electrode to channel 1 and place it over the back of the head, for example at O1 or Pz, where Alpha activity is usually strongest. Connect the reference and bias as described in OpenBCI’s documentation. Studio names these channels 1, 2, 3 and so on, and has no electrode positions for this board, so keep track of which electrode is on which channel.
Use output 1 of the node.
In 1.7.3: The OpenBCI Daisy channels are named P3, P4, Oz and so on instead of 1 to 16. Use the first channel output, P3.
Getting the frequency band
Section titled “Getting the frequency band”To get the Alpha band activity, we first need to map the signal onto the frequency domain.
- Open the DSP category of the palette and drag a Fast Fourier Transformation (FFT) node into the graph.
- Drag from the channel output of the device node to the In input of the FFT node.
To remove a connection later, right-click it and choose Remove Connection.
With its default FFT Order of 9, the node needs 512 samples before it produces its first spectrum. That is about 4 seconds at 128 Hz and about 2 seconds at 250 Hz.
In 1.7.3: The FFT Order defaults to 7, so the node needs 128 samples, about 1 second at 128 Hz and about 0.5 seconds at 250 Hz.
Visualising the frequency spectrum
Section titled “Visualising the frequency spectrum”The FFT node gives us a frequency spectrum. To see it, drag in a View node from the Output category and connect Out (Spectrum) of the FFT to the In (Spectrum) input of the View node.
A frequency spectrum is rendered in the Spectrum View window, which the current layout does not contain yet. Choose Windows > Add > Spectrum View. The window opens floating.
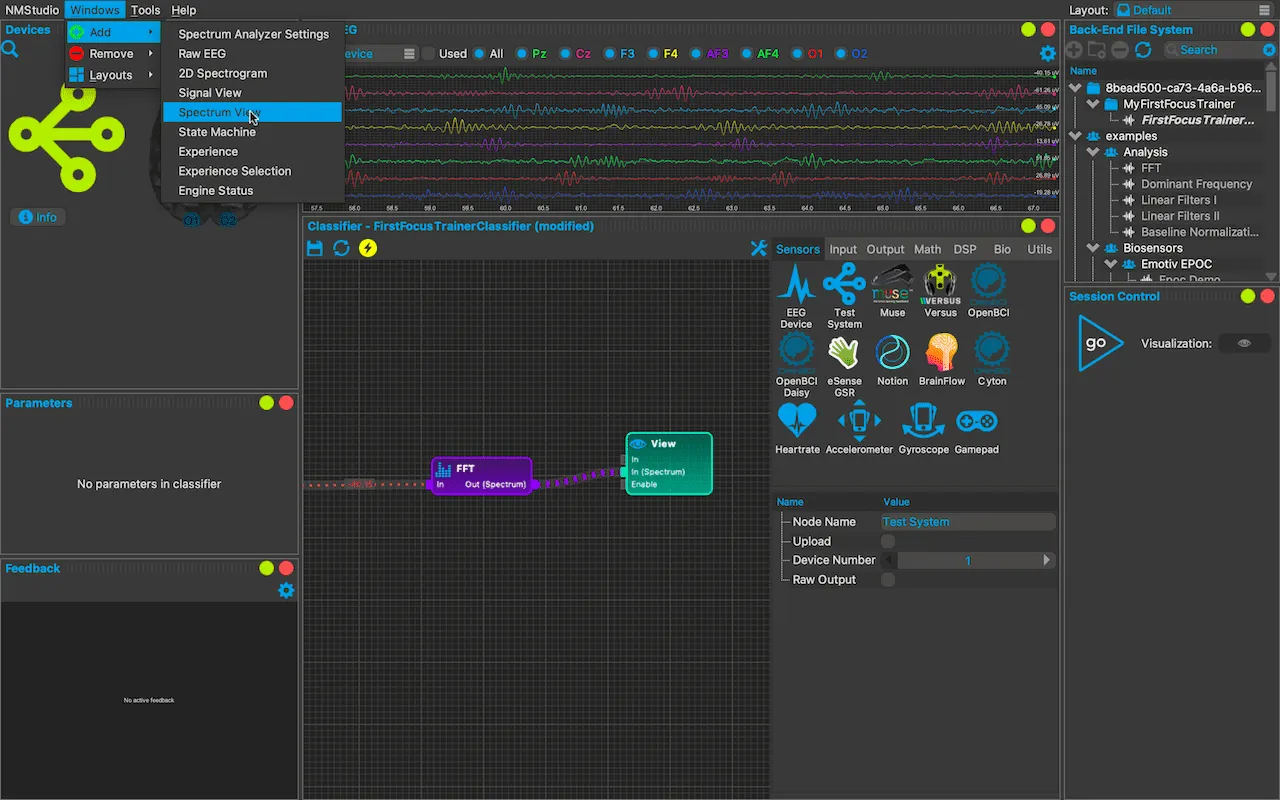
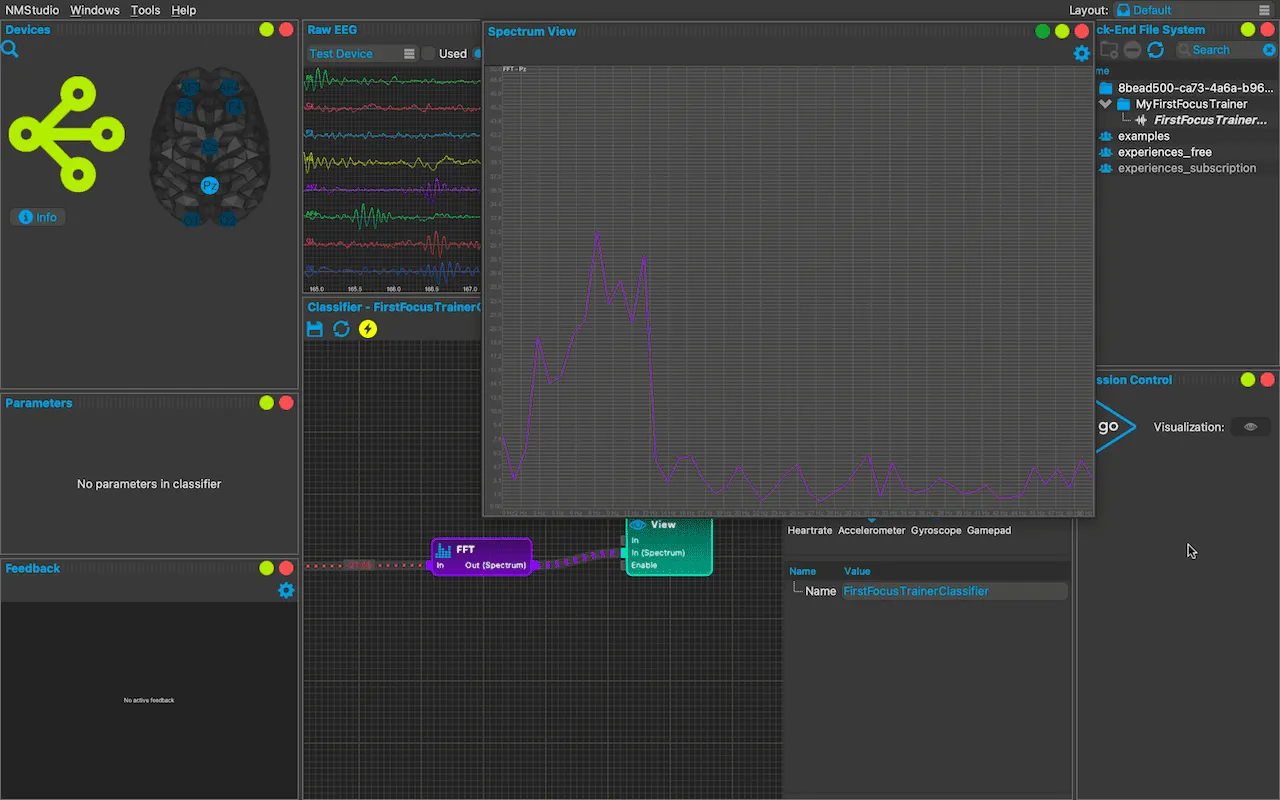
You now see the frequency spectrum of your source. Its shape depends on the source and, for a real sensor, on the person and the electrode position.
To get the Spectrum View out of the way, drag the window by its title. It snaps into the layout. See Layouts.
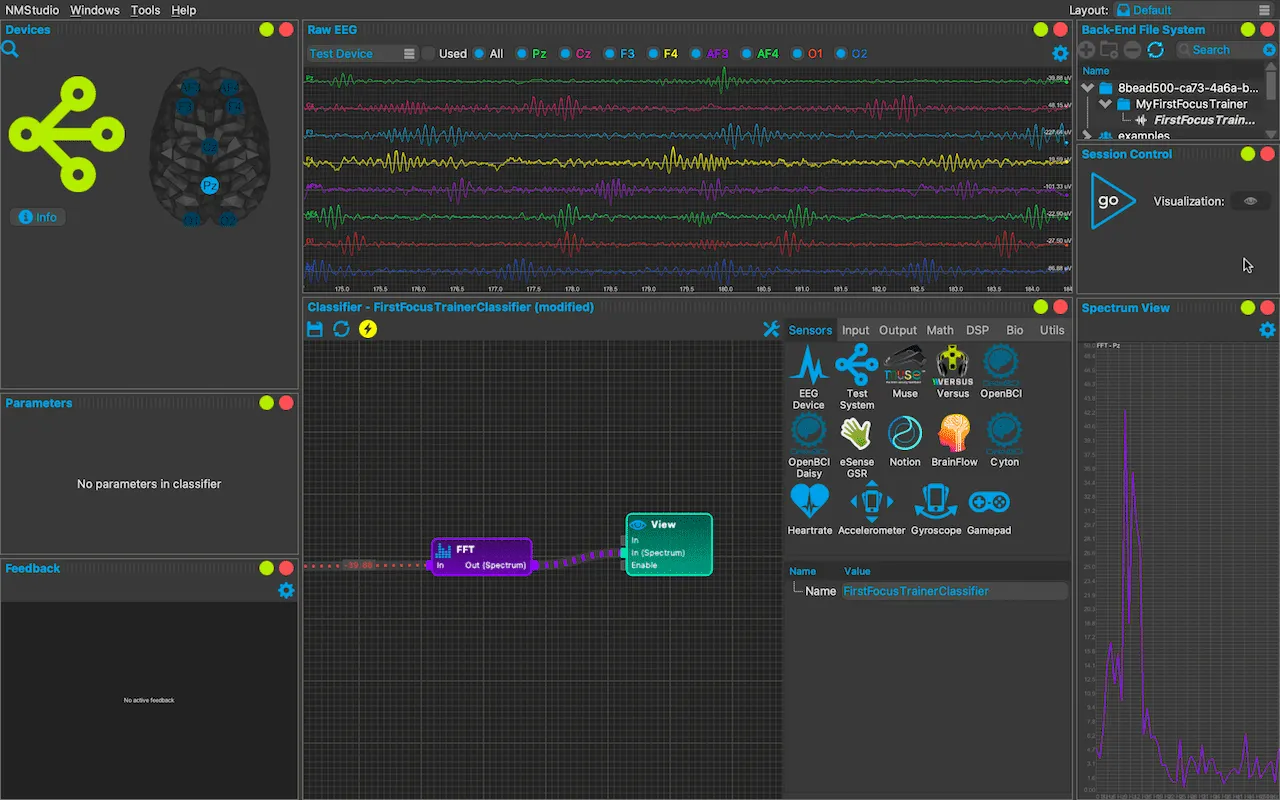
Getting the Alpha band amplitude
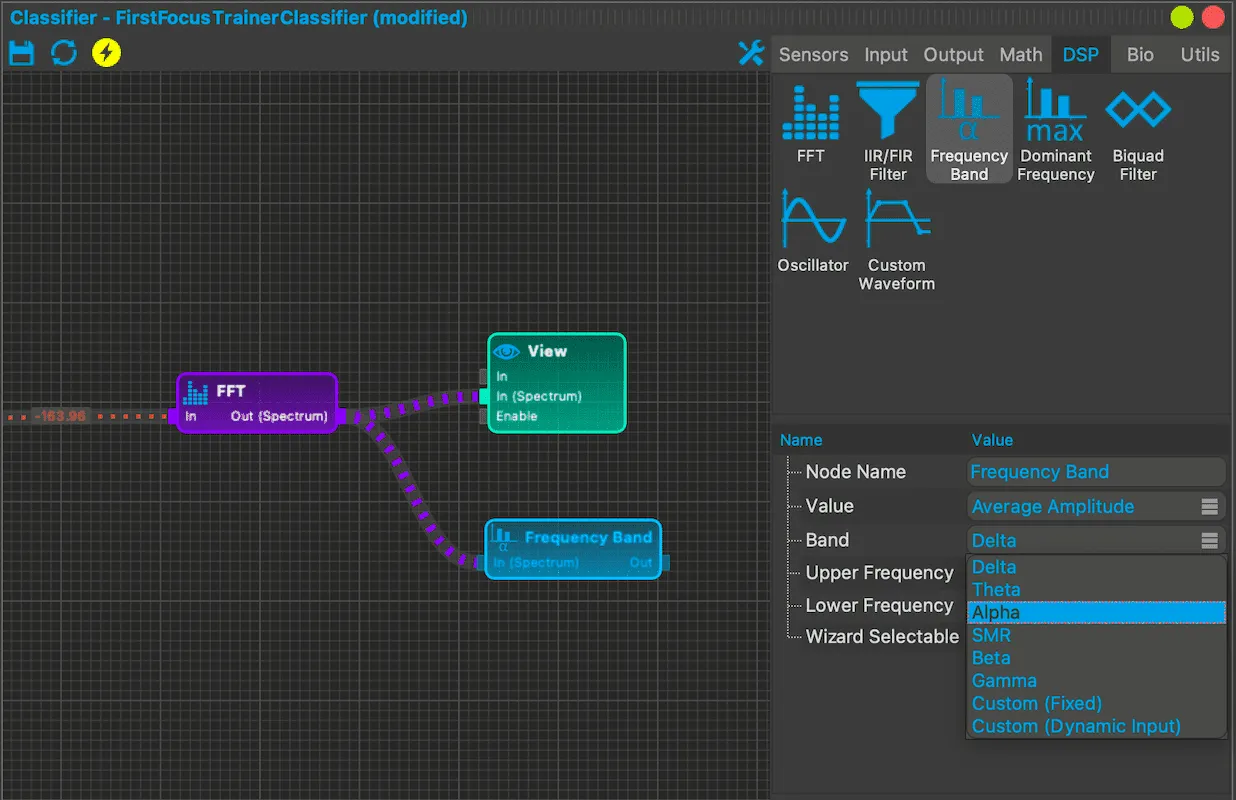
Section titled “Getting the Alpha band amplitude”- Drag a Frequency Band node from the DSP category into the graph, and connect Out (Spectrum) of the FFT to its In (Spectrum) input.
- Click the node and set Band to Alpha (8 to 12 Hz). The default is Delta, so don’t skip this step. Value already defaults to Average Amplitude.
Controlling the brightness
Section titled “Controlling the brightness”The Brightness Control node sets the brightness of the Experience window. It expects a value from 0 to 1, where 1 is full brightness and 0 is black. Its range is fixed. The output of Frequency Band is not in that range, so we remap it first and then smooth it.
- Drag a Remap node from the Math category into the graph and connect the Out output of Frequency Band to its top input. This input has no fixed label. It shows the input range, so it reads
[0, 30]after the next step. - Set Input Min to 0, Input Max to 30, Output Min to 0 and Output Max to 1, and turn Clamp Output on. Without clamping, a value above 30 would put the Brightness Control node into the error “Value not in range”, and an error blocks the session.
- Drag a Statistics node from the Math category into the graph and connect the output of Remap to its In input. Set Length (Seconds) to 3. Statistic already defaults to Mean. This averages the brightness over the last 3 seconds.
- Drag a Brightness Control node from the Output category into the graph and connect the output of Statistics to its In input.
The value 30 is only a starting point. It maps an average Alpha amplitude of 30 or more to full brightness. Typical amplitudes depend on your source, so check the value shown on the connection after Frequency Band and adjust Input Max to suit.
In 1.7.3: The FFT node does not apply its window function and does not remove the signal mean, so amplitudes differ. Check Input Max there too.
The node type is what counts here. A Custom Feedback node named “ScreenBrightness” does not change the brightness, and no error tells you so. To control volume the same way, use a Volume Control node from the Output category. Its default Mode is Studio Volume. A Custom Feedback node named “Volume” only raises a deprecation warning. See Nodes.
To feed back a different band, change Band on the Frequency Band node.
Saving the classifier
Section titled “Saving the classifier”Click the Save icon on the toolbar of the Classifier window. Save often. “(modified)” in the window title means there are unsaved changes, and when you exit Studio, the dialog only offers to discard them or to cancel.
Creating the state machine
Section titled “Creating the state machine”Now we add the application logic. The user first sees a screen with 3 buttons to choose the duration. Then they see the video, whose brightness follows the Alpha amplitude.
- In the Layout box at the top right of the main window, choose State Machine Designer. You can also use Windows > Layouts.
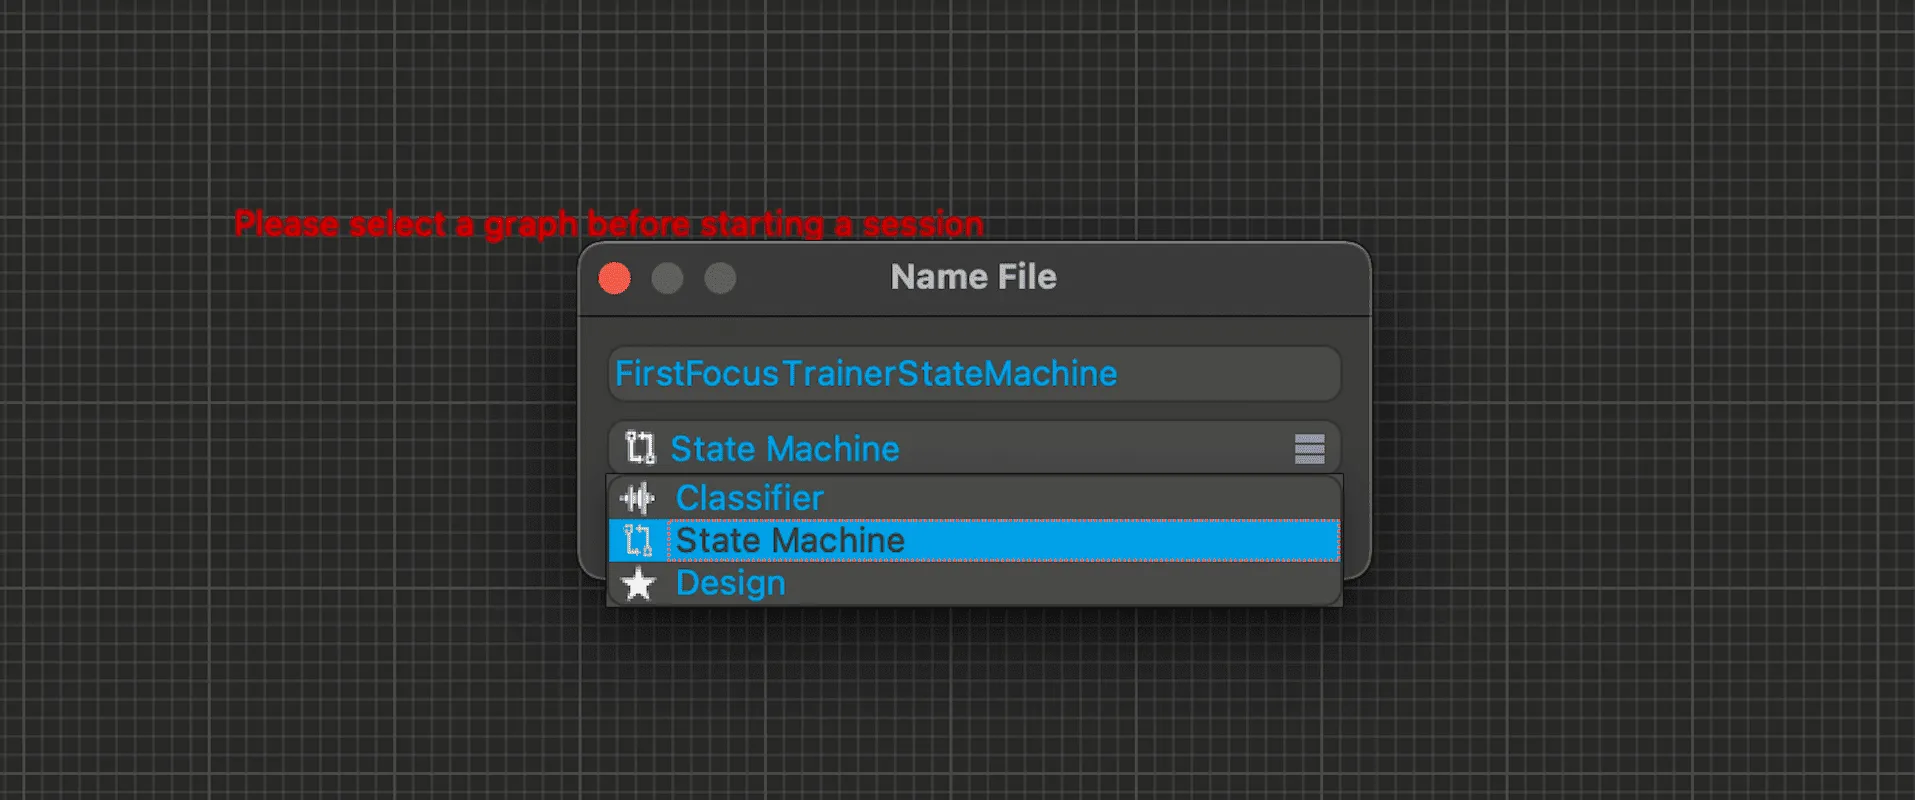
- In the Back-End File System window, select your folder and create a new file as before. Set the type to State Machine.
- Double-click the new file to open it.
Adding states to the state machine
Section titled “Adding states to the state machine”A state machine needs a Start state for any of its states to activate, and an End state for the session to stop automatically. Between them are Action states, which can fire events such as showing text or starting a video when they are entered or exited. The state machine moves between states along transitions when their conditions are met.
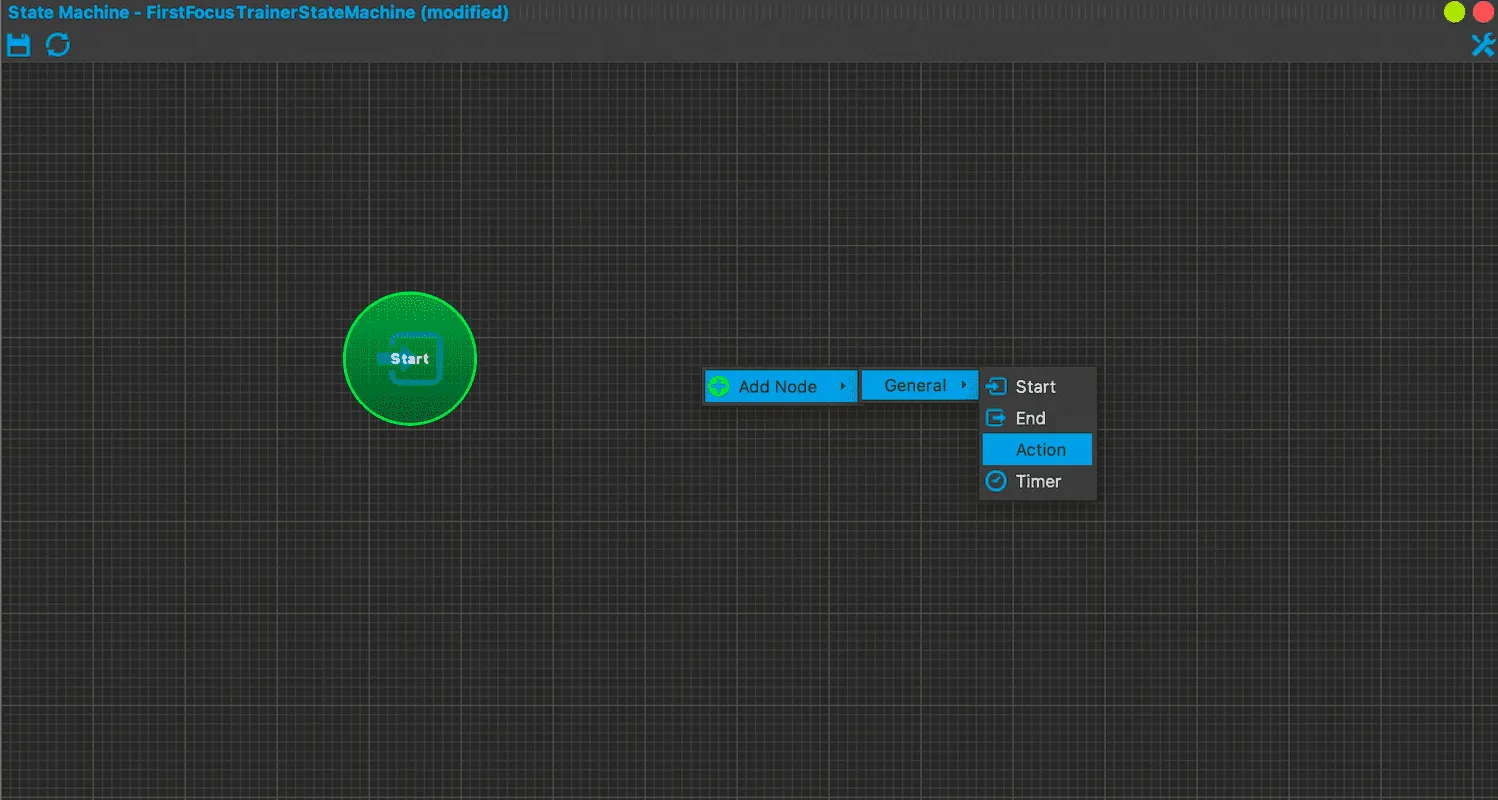
- Right-click in the State Machine window and choose Add Node > General > Start. You can also drag states from the General palette.
- Add an Action state the same way.
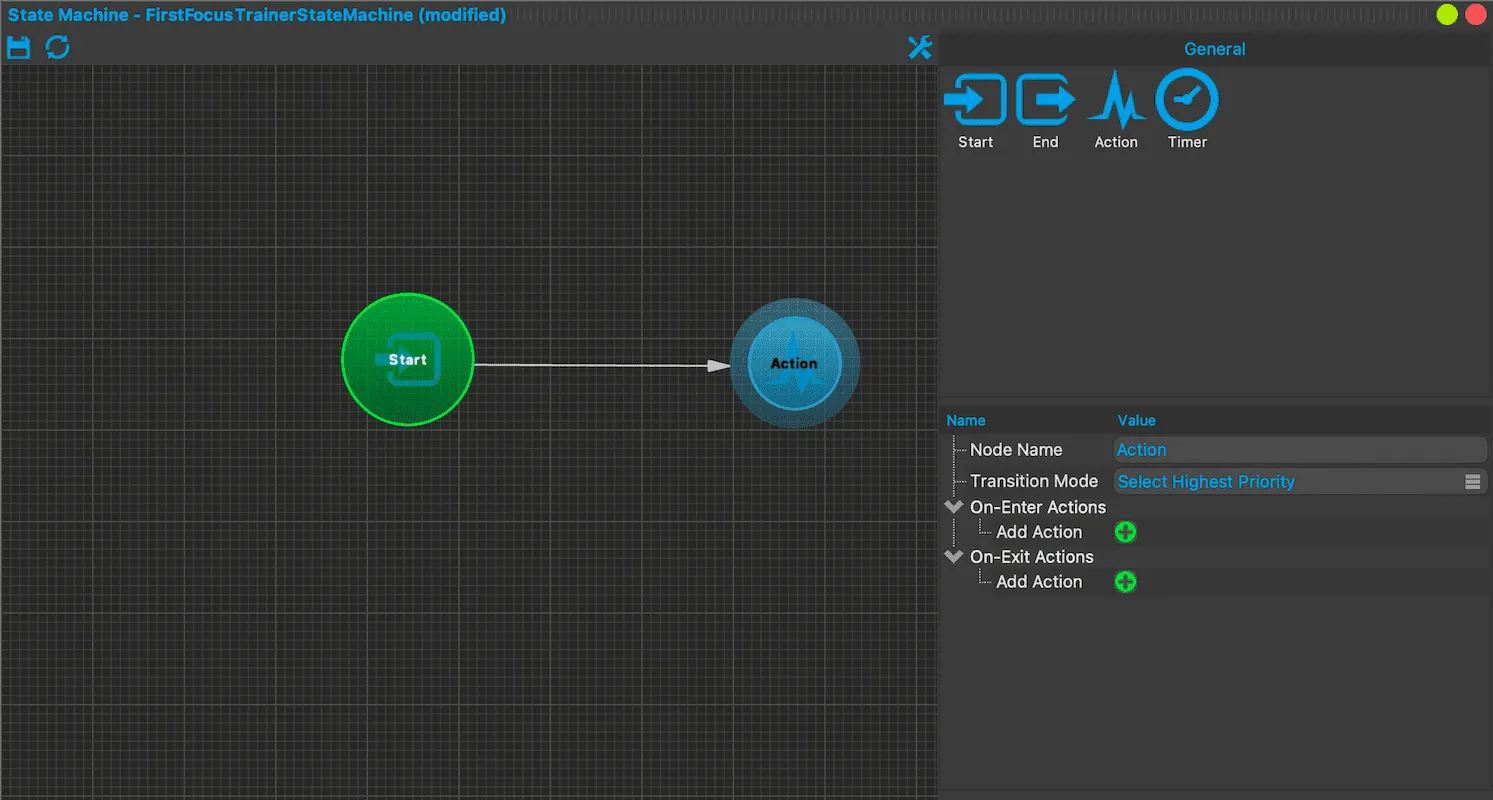
- Draw a transition from Start to Action. Press the left mouse button on the outer rim of the Start circle, drag to the Action state and release. A transition with no conditions fires as soon as its source state is active, so this one needs no condition.
Setting up the training duration
Section titled “Setting up the training duration”The first Action state asks the user to select the duration.
- Click the state and set Node Name to
Select Duration. - Under On-Enter Actions, click the green plus next to Add Action and choose Show Text.
- In Text, enter
How long do you want to train?
Adding the experience window
Section titled “Adding the experience window”To see the experience in action we need the Experience and Session Control windows.
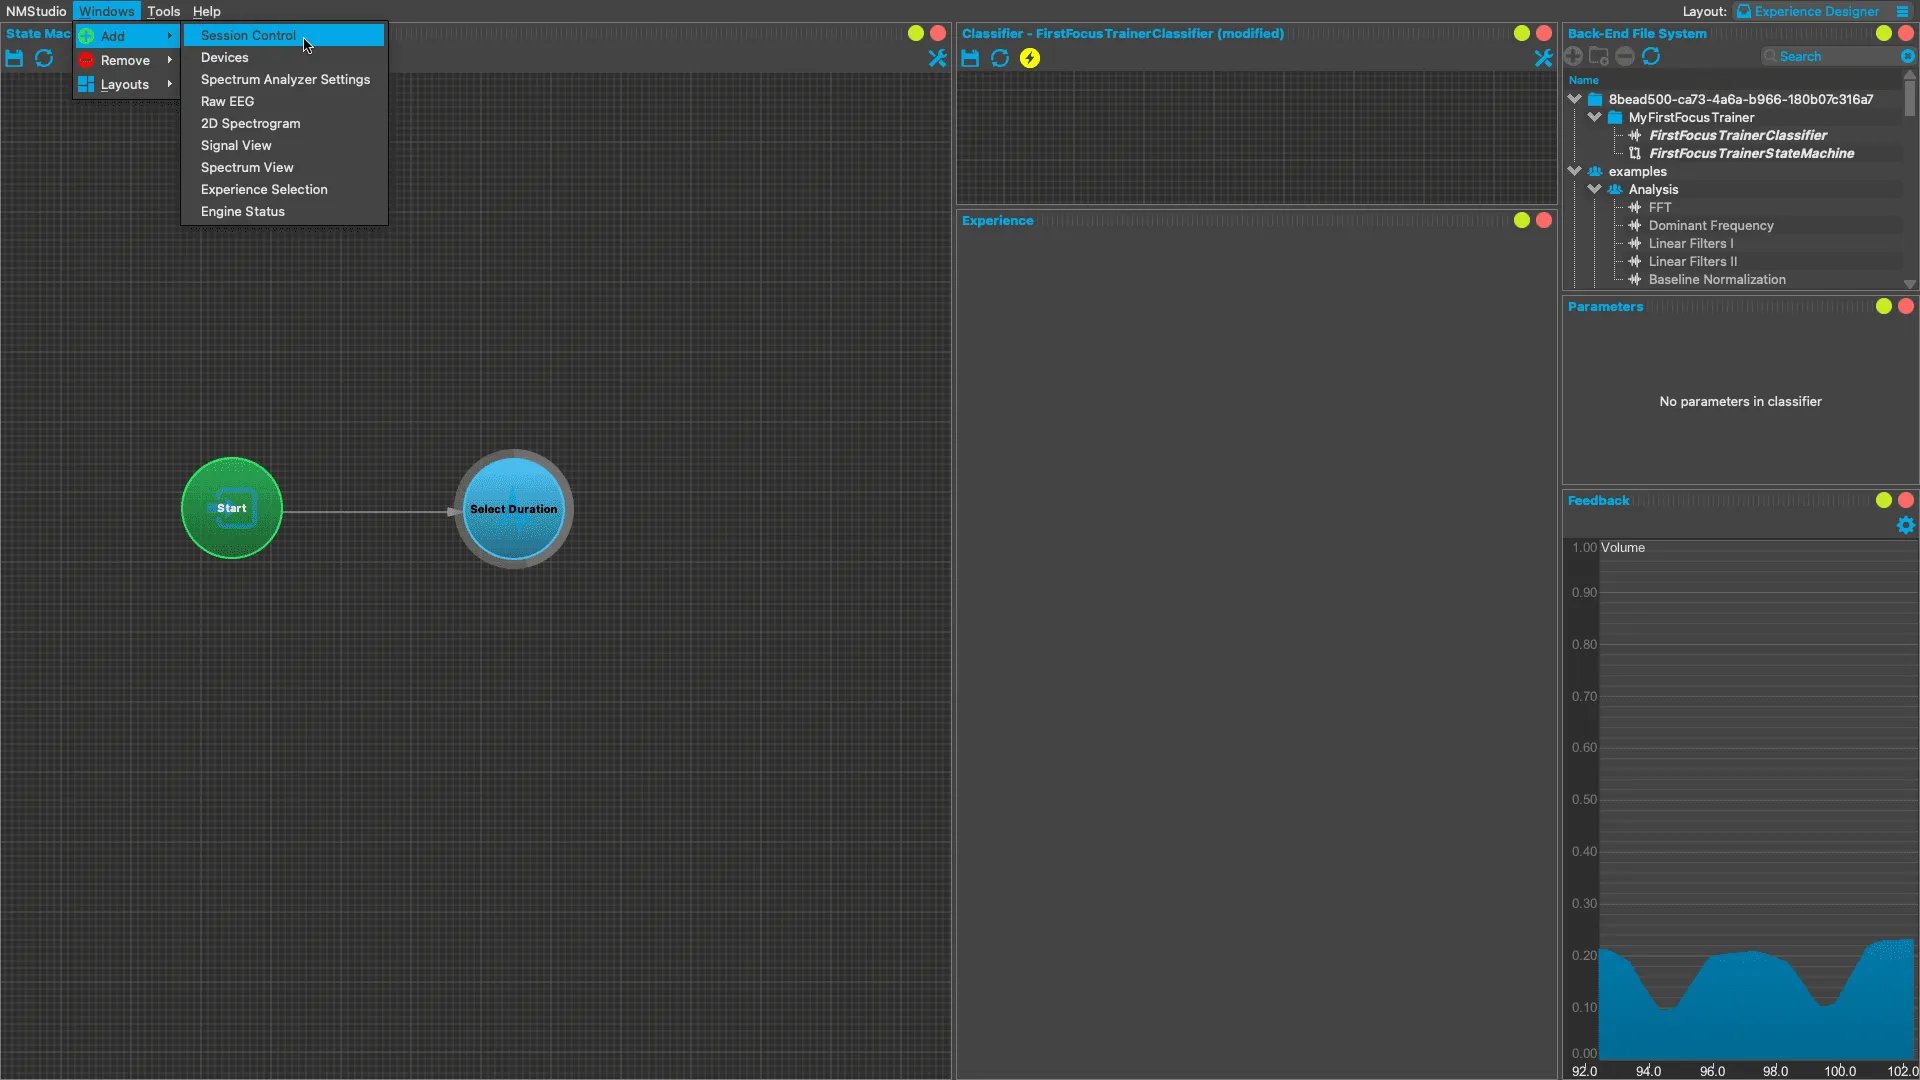
- In the Layout box, choose Experience Designer. It contains the State Machine, Classifier and Experience windows.
- Choose Windows > Add > Session Control.
To try what we have so far, click the Begin Session button in the Session Control window. It is the large “go” icon, with the tooltip “Begin Session”. If you can’t click it, see Running the session. The Experience window shows the prompt.
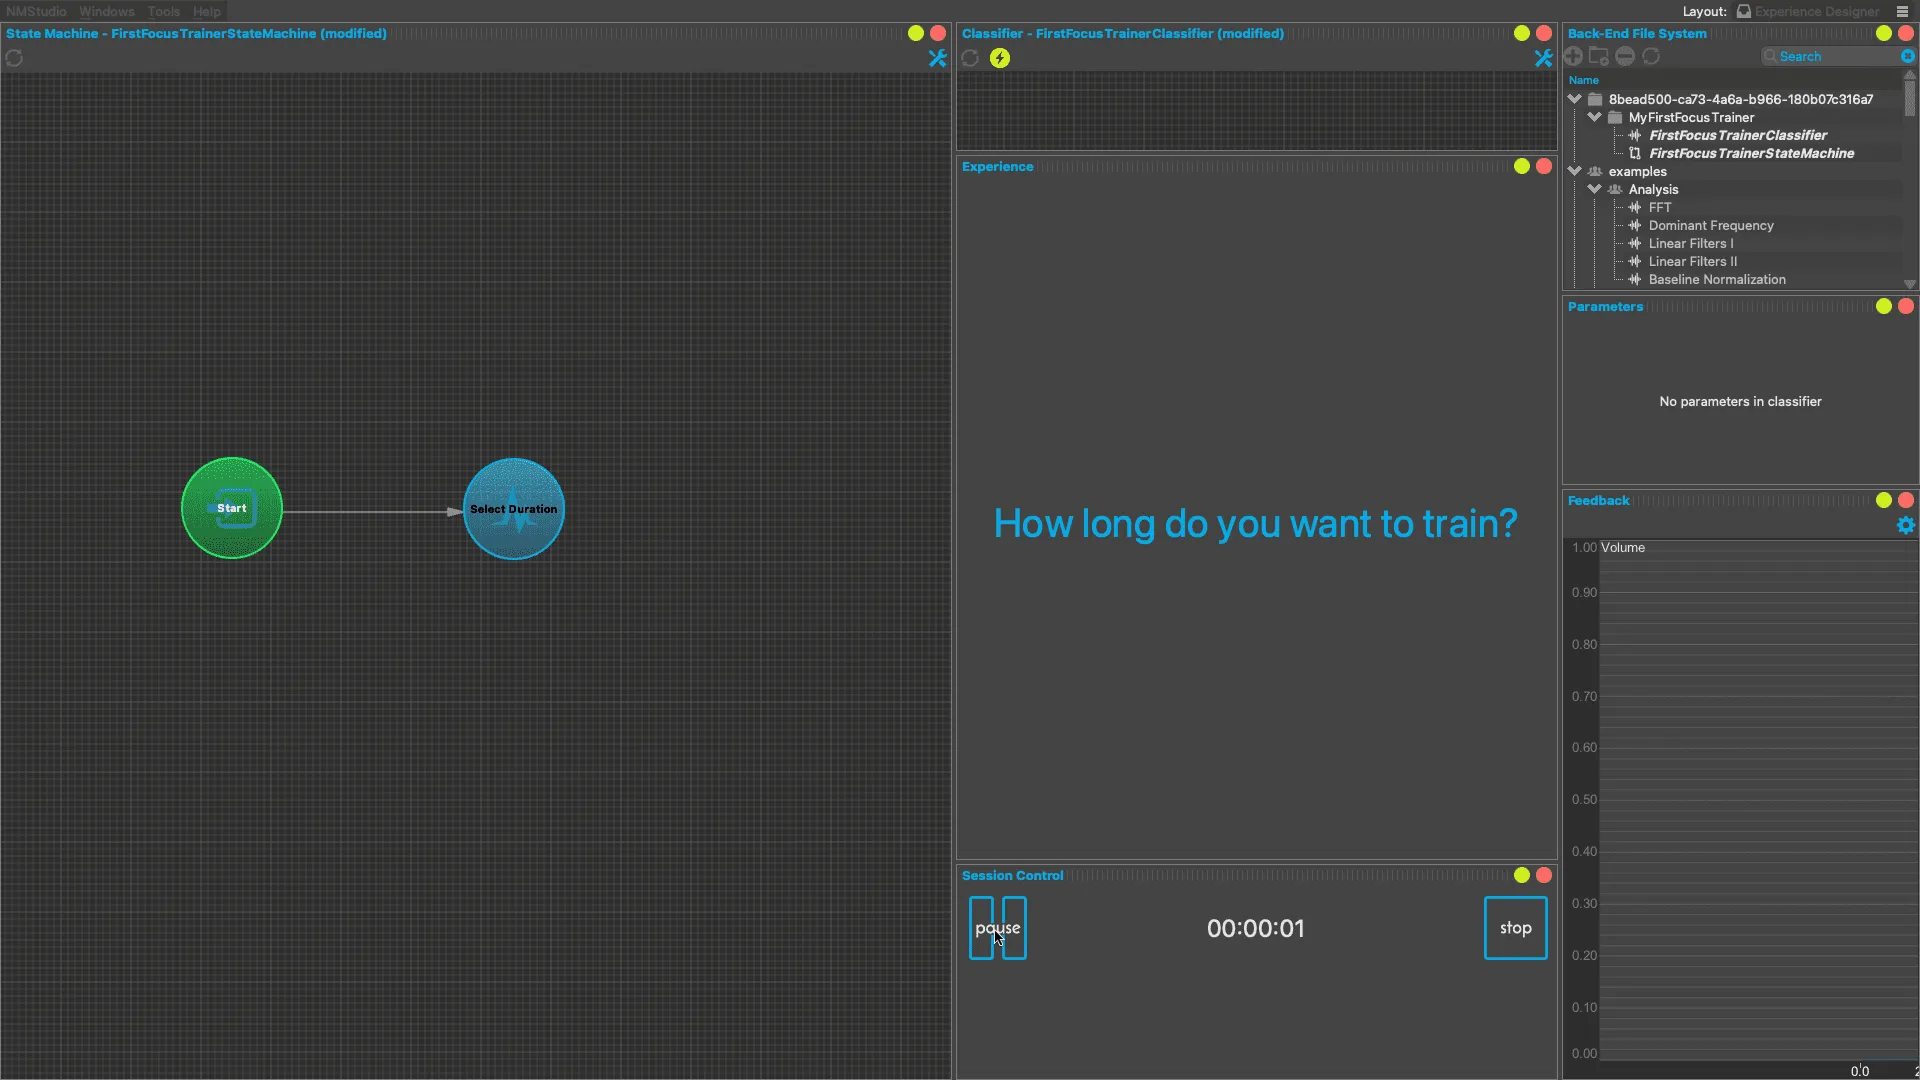
Stop the session with the stop button (tooltip “End the Session”) before you continue. The file system, the menu bar and the Save icons are not available during a session.
Adding buttons to select the training duration
Section titled “Adding buttons to select the training duration”We offer 3 options: 1, 3 or 5 minutes. Each option gets its own Action state, reached through a transition with a Button Condition. For every Button Condition on a transition leaving the active state, the Experience window shows a button at the bottom.
- Add 3 more Action states.
- Draw a transition from Select Duration to each of them.
- Click the first transition’s arrow. Under Conditions, click the green plus next to Add Condition and choose Button Condition.
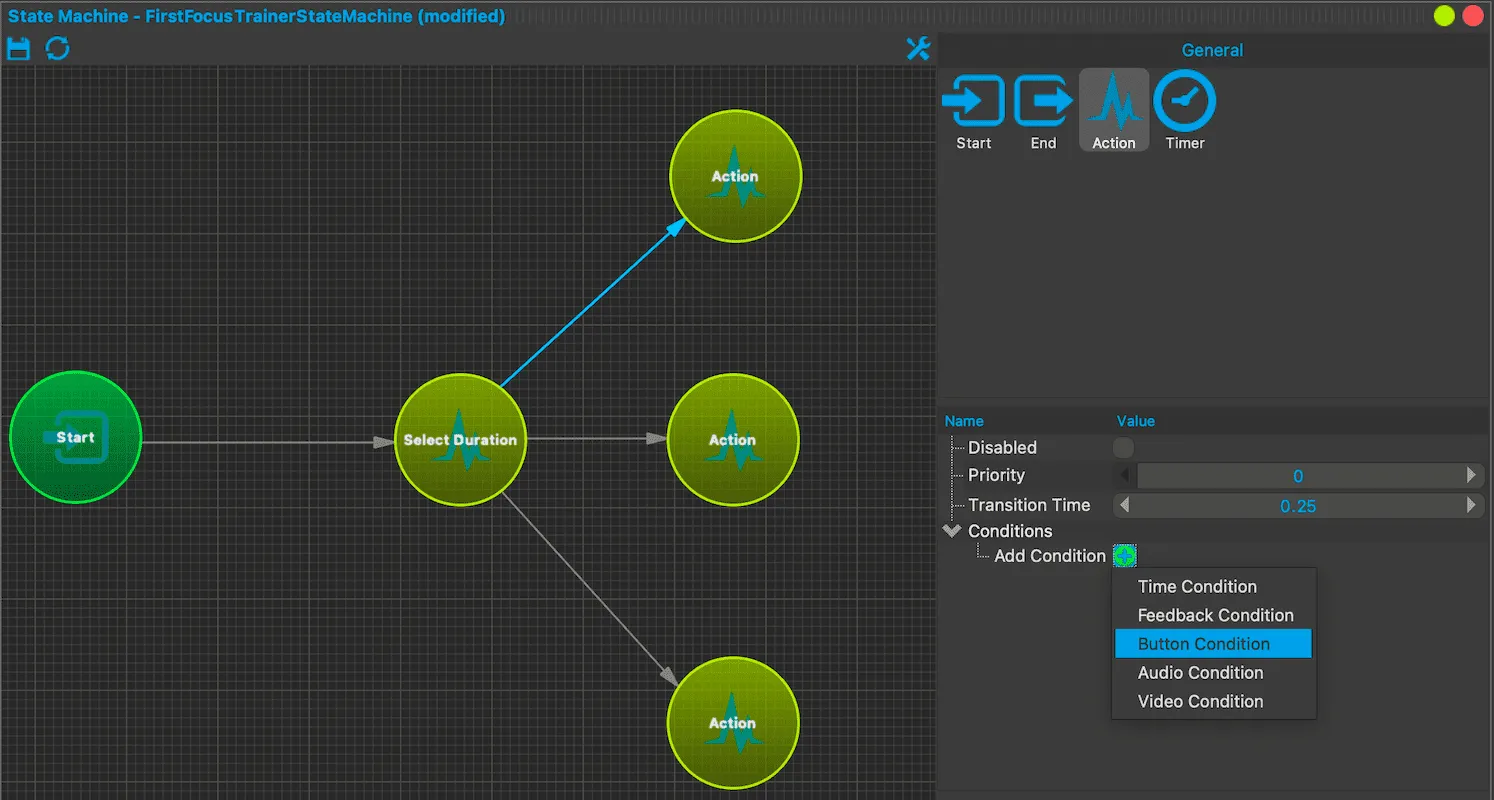
- In Text, enter
1 minute.
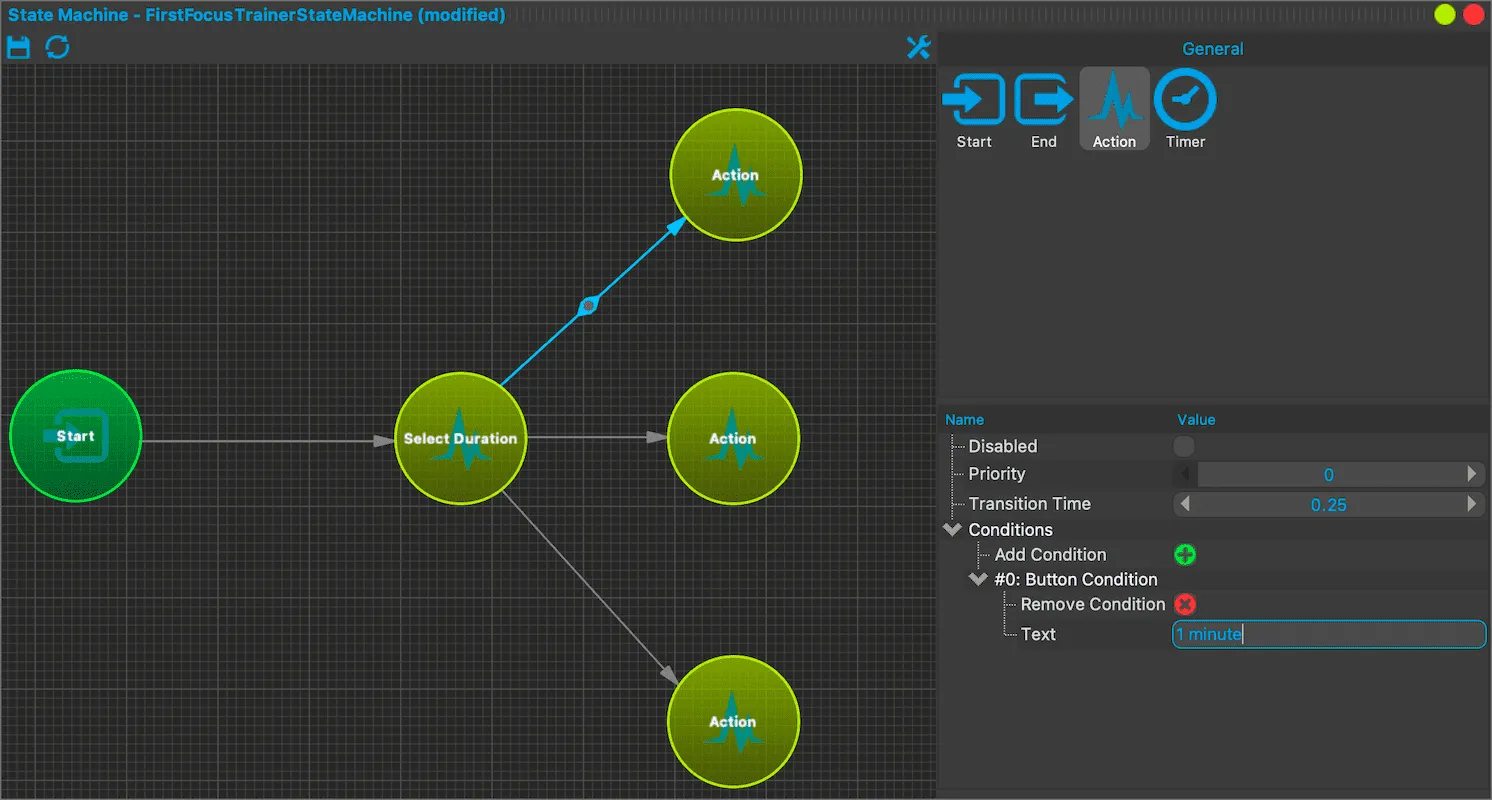
- Do the same for the other 2 transitions, with the text
3 minutesand5 minutes. - Click each state and set its Node Name after the button on the transition leading to it:
1 minfor the1 minutebutton,3 minsfor3 minutesand5 minsfor5 minutes. The names are only labels, so a wrong pairing gives no error. The button would then set the wrong duration in the next section.
The buttons disappear again when the state is left.
Sending data from state machine to classifier
Section titled “Sending data from state machine to classifier”To check whether the time is up, the classifier needs to know the chosen duration. A Parameter action in the state machine sends it there.
- Click the
1 minstate. Under On-Enter Actions, add a Parameter action.
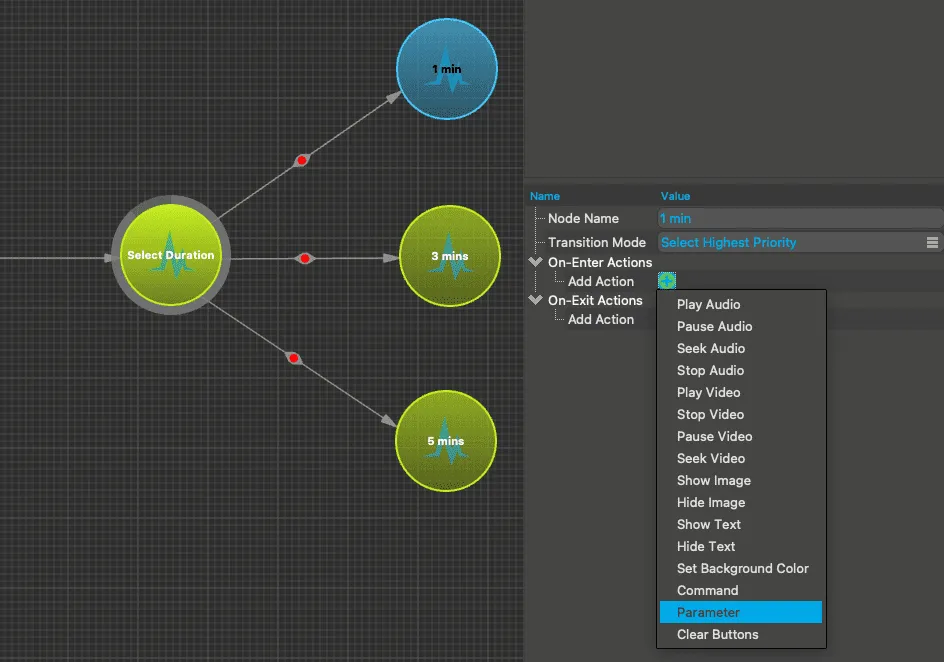
- Set Parameter Name to
Duration, leave Function on Set to Value, and set Value to60.
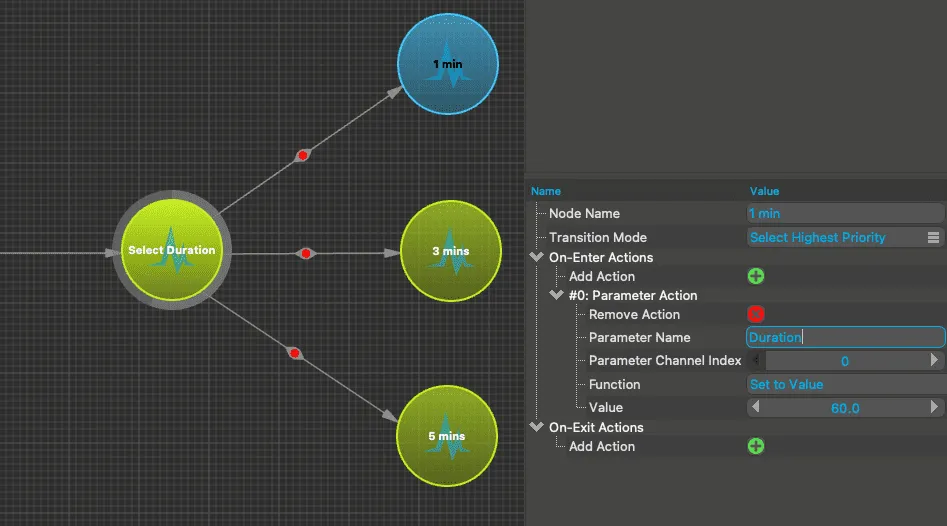
- Do the same for
3 minswith the value180and for5 minswith the value300.
Checking if the duration is over
Section titled “Checking if the duration is over”Now we add the check to the classifier, in the Classifier window.
- Drag a Session Info node from the Input category into the graph. Its Elapsed Time output is in seconds by default.
- Drag a Parameter node from the Input category into the graph. Set its Node Name to
Duration, exactly as in the Parameter actions. - Set Sample Rate of the Parameter node to
128, the rate of Session Info. At the default of 0, it follows the rate of the device (250 Hz for a Cyton or BrainFlow Synthetic, 125 Hz for a Cyton with Daisy). Compare needs matching rates, and any graph error blocks the session. - Set Value of the Parameter node to a large number, such as
3600, so the check cannot fire before the state machine sets the real duration. - Drag a Compare node from the Math category into the graph. Connect Elapsed Time to its x input and the Parameter output to its y input. Swapping them would end the session as soon as the video starts.
- Set Function to Greater than (x > y). The default is Equal to. The output is now 1 once the elapsed time is greater than the duration, otherwise 0.
- Drag a Custom Feedback node from the Output category into the graph and connect the Compare output to its In input. Set its Node Name to
TimerEnded. The state machine can read this value by name. Its default range of 0 to 1 fits. - Save the classifier.
Playing the video
Section titled “Playing the video”After the user has selected the duration, we play a video. Back in the State Machine window:
- Add another Action state and set its Node Name to
Play Video & Audio. - Draw a transition from each of
1 min,3 minsand5 minsto this state. These transitions need no condition. - Under On-Enter Actions, add these actions:
- Play Video. In Video URL, enter the full web URL of your video. If the video is shorter than 5 minutes, turn on Loop Forever. The next section explains why.
- Hide Text, to remove the prompt.
- Optional, in case your video has no sound: Play Audio. In Audio URL, enter the full web URL of your audio file.
The tooltips on these fields also offer a local file name. Studio passes such a name to the media player as a URL and does not treat it as a path on your computer, so it may not play.
Ending the neurofeedback session
Section titled “Ending the neurofeedback session”The last thing to add is the End state. We want to end the session when the time is up or, if you added audio, when the audio is finished. All conditions on one transition must be met at the same time, so an either-or end needs one transition per condition.
- Add an End state.
- Draw a transition from
Play Video & Audioto End and add a Feedback Condition. Set Feedback Node Name toTimerEnded. Leave Test Value on 0 and Test Function on feedback > testValue. - If you added audio, draw a second transition from
Play Video & Audioto End and add an Audio Condition. In Audio URL, enter exactly the URL from the Play Audio action. Start and end this transition at a different point on the circles, so that the arrows don’t lie on top of each other and you can click each of them.
The end of the video does not end the session. Without Loop Forever, the picture goes black and the session keeps running until the time is up. So pick a video at least as long as the longest duration, 5 minutes here, or turn on Loop Forever on the Play Video action.
Don’t use a Video Condition here. It stays false in the Experience window, as the note in the State machine reference explains. To end the session when a video ends, add a transition with a Time Condition set to the video’s length instead.
Elapsed Time counts from the start of the session, so it includes the time the user spends on the selection screen. The video part is therefore shorter than the button says by that amount. Time while the session is paused does not count.
Now click the Save icon on the State Machine window’s toolbar.
Running the session
Section titled “Running the session”Before you start, check that:
- Both files are open and saved.
- Your source is connected and streaming. For Test System this is automatic when no other device is connected. For BrainFlow Synthetic, press Apply first.
- The classifier has no errors.
If a graph has an error, the Session Control window shows “A graph contains errors” and you can’t begin a session. A device that is not connected also counts as an error, shown as “Device not connected”. Click the error icon on the graph’s toolbar (tooltip “Design has Errors (click to show)”) to see the list.
Click the Begin Session button. Choose a duration in the Experience window. The video plays, and its brightness follows the signal. You have built your first neurofeedback application.
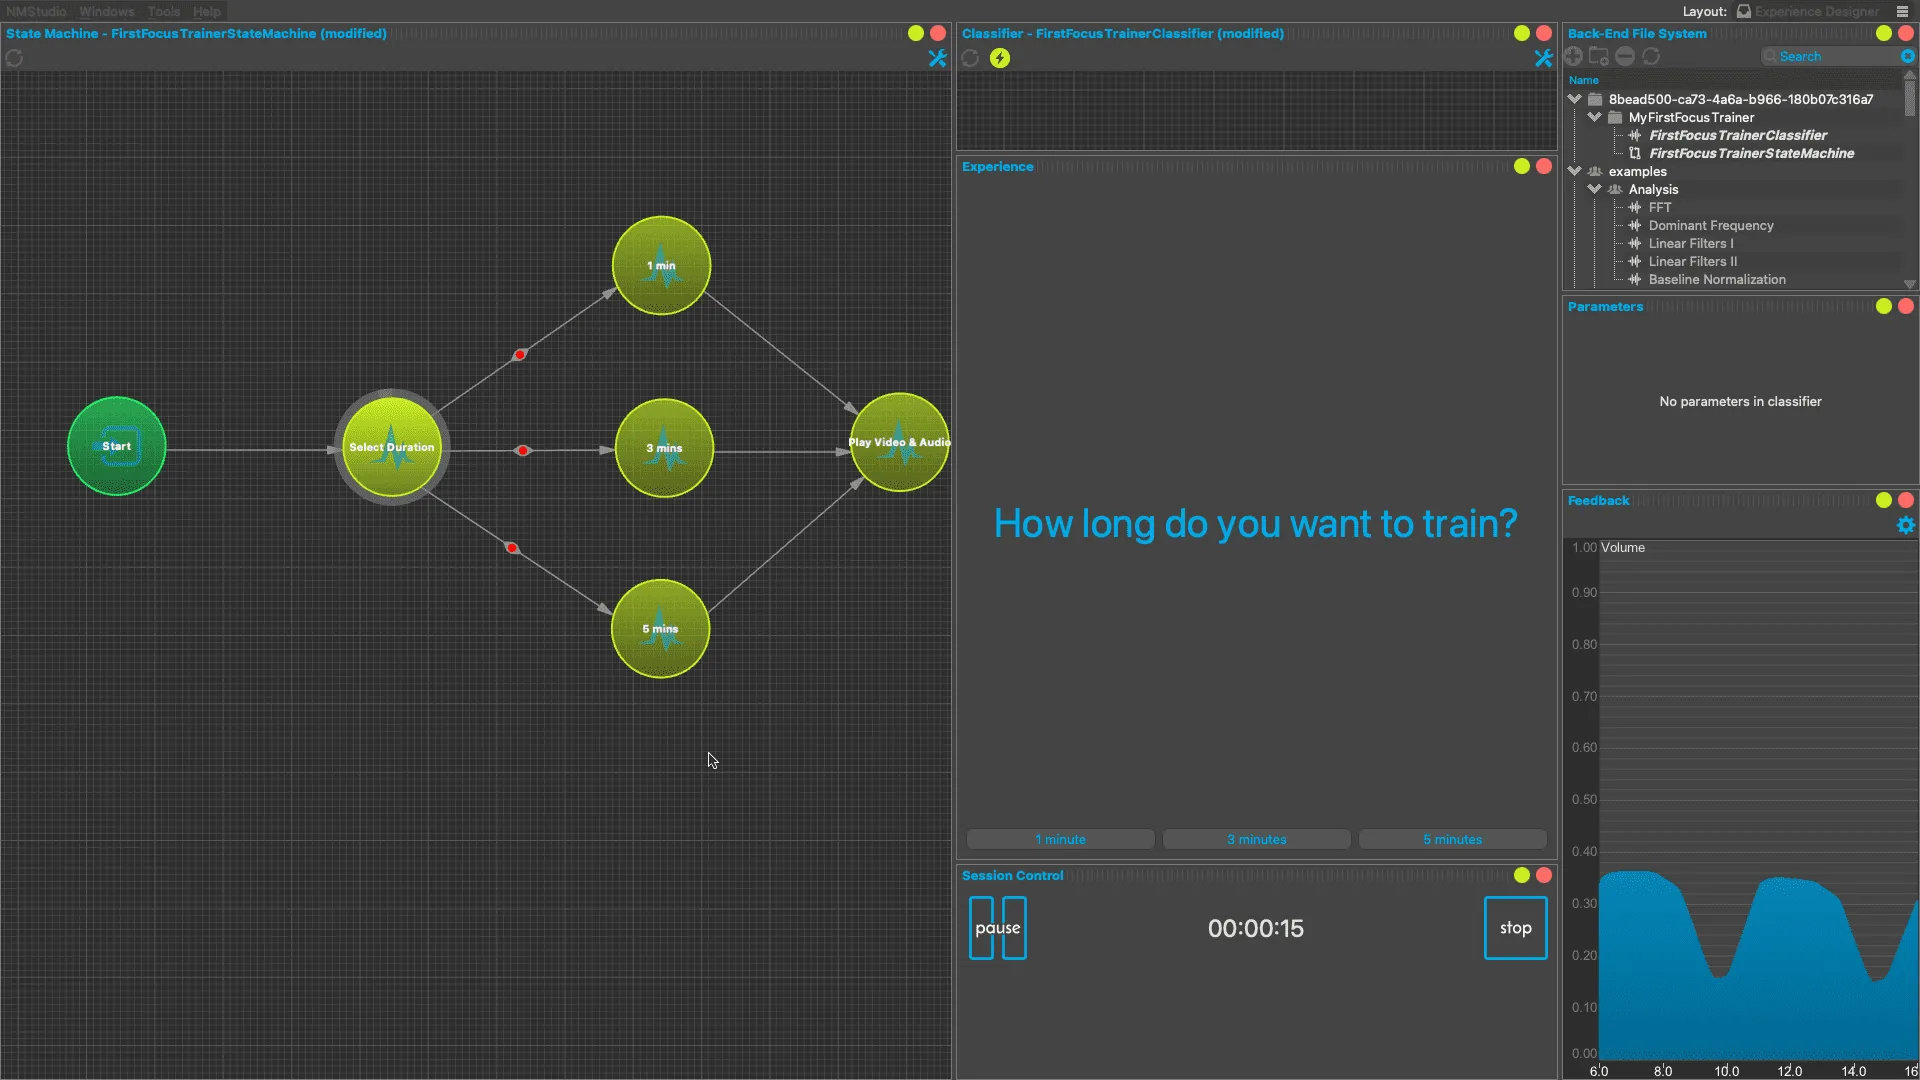
When the End state is reached, the session stops by itself. To stop earlier, use the stop button. See Running a session.
Browsing other files
Section titled “Browsing other files”Your account may also show shared folders, such as examples, in the Back-End File System window. It works like Windows Explorer or macOS Finder. A single click selects an item, and a double-click opens it.
Whether you can change a file depends on the permissions that come with it. To edit a copy of a file you can’t change:
- Double-click the file to open it. The copy fails with an error if the file is not open.
- Right-click the file and choose Copy To Personal Folder.
The copy appears in My files with _Copy added to its name.
Your account may also have Help > Product tour. It walks through a prebuilt example, and its text predates the Brightness Control node, so follow this page where they differ.